


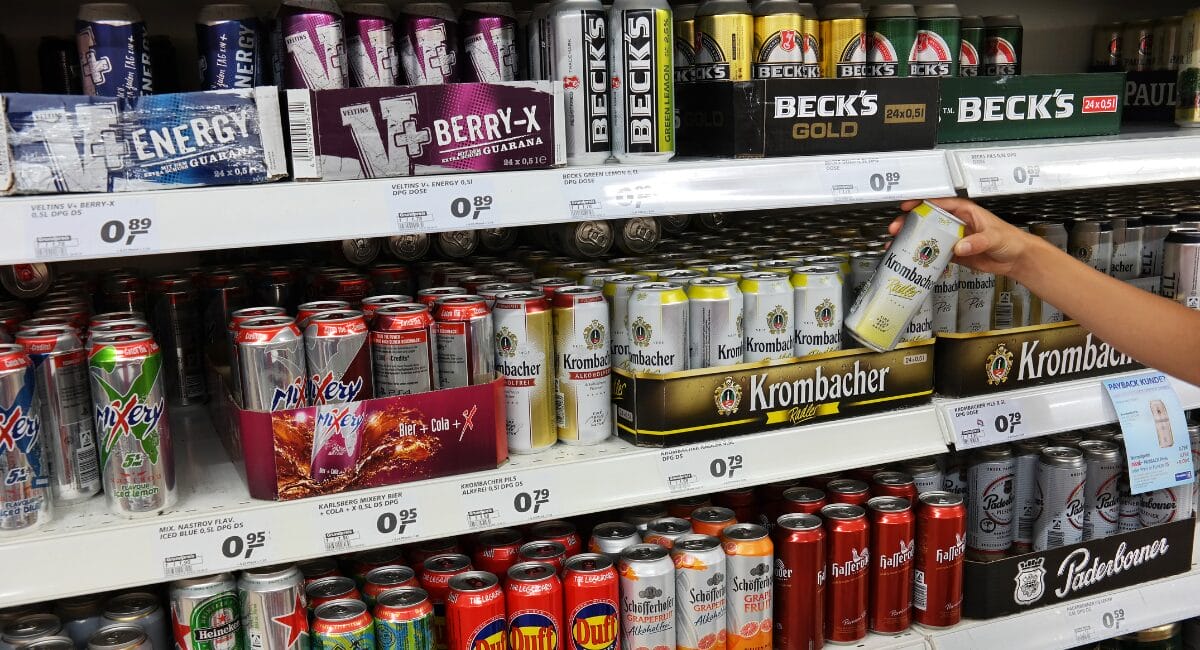
A new report by Eunomia on behalf of the International Aluminium Institute shows: Aluminium cans are collected and recycled significantly more frequently worldwide than PET and glass bottles. The study covers over 80 per cent of the global market for beverage packaging and provides updated recycling rates for the year 2025.
The „Global Beverage Recycling Dataset“ report updates a previous study from 2017 and calculates the „Collected for Recycling“ rate (collected quantities that go to reprocessors) and the actual recycling rate for three beverage packaging formats - aluminium cans, PET and glass bottles - based on the output quantities from the last process step.
According to the results presented, aluminium cans achieve a global collection rate of 75.6% and a recycling rate of 74.8%. PET bottles achieve a collection rate of 61.3 per cent and a recycling rate of 47.0 per cent, while glass bottles achieve 44.5 per cent and 41.9 per cent respectively. This means that aluminium cans perform significantly better than the other two beverage packaging types in a global comparison.
High PET losses between collection and recycling
The gap between collection and actual recycling is particularly striking in the case of PET bottles. The study shows a global loss of 23.4 percent for PET between „collected for recycling“ and recycled quantities, while the losses for glass are 5.8 percent and for aluminium - in relation to sorting losses - around one percent.
Eunomia cites losses in sorting and treatment processes as the cause, which are particularly significant for plastic bottles. It is clear that, depending on the collection system, relatively high flat loss rates of 19 per cent (separate collection) or 29 per cent (mixed collection via MRFs) were applied to PET. These assumptions are based on previous studies, interviews with processors and material flow analyses and are not considered to be country-specific, but rather globally generalised.
Methodology with a focus on large markets
To calculate the global quotas, 35 countries and regions were selected that cover between around 84 and over 90 per cent of the global „put on market“ (POM) - i.e. the quantities placed on the market - depending on the material. These include China, the USA, Europe, Japan, Brazil, Mexico and large markets in Africa, Latin America and the Middle East. The selection was made on the basis of POM data provided by Reloop, among others.
Where only collection rates were available, Eunomia modelled loss rates between collection and recycling and thus derived recycling rates. The losses were modelled depending on the predominant collection system (separate collection, deposit systems, mixed collection, informal collection). For countries without usable data, the study also used regional average values.
Data situation often weak - especially outside Europe and North America
However, it was found that data quality was often rated as „red“, particularly in emerging and developing countries - for example because sources are more than five years old, definitions remain unclear or data comes from studies that are difficult to verify. Only a small number of countries had „green“ data sets, particularly Japan, South Korea, parts of Europe and individual markets such as Australia and Canada.
Despite these uncertainties, Eunomia concludes in the summary that the core statements remain robust: Aluminium cans achieve the highest collection and recycling rates globally, PET bottles have the highest losses along the value chain, and closing data gaps on regional averages does little to change the global results.
Source: Eunomia